
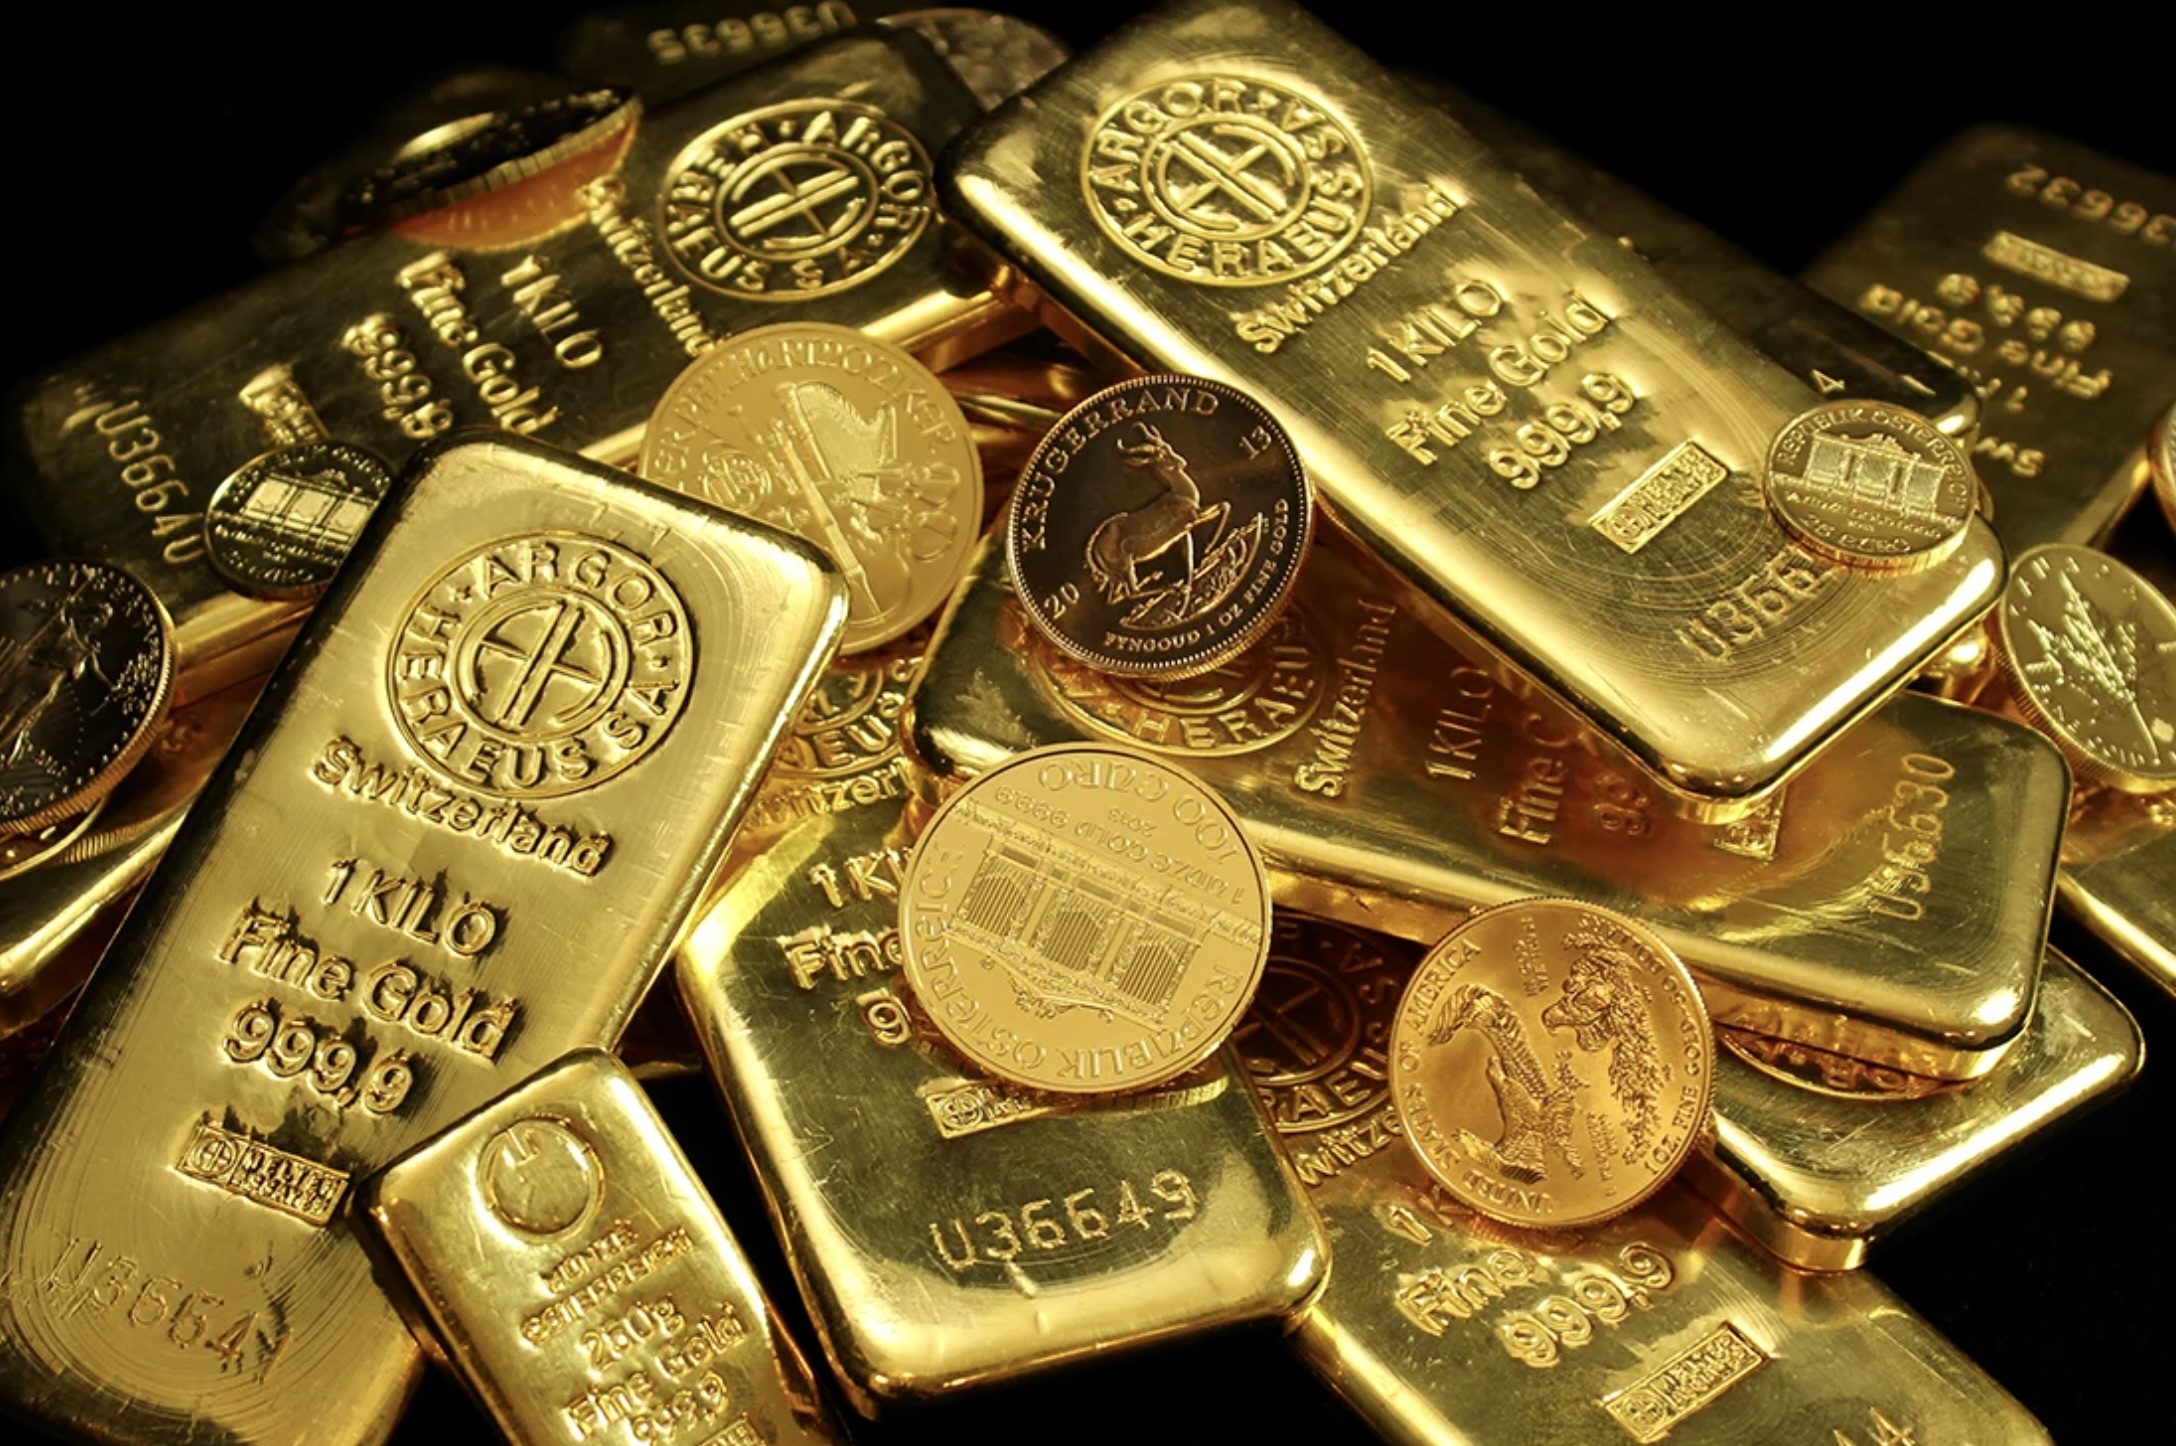
NEW YORK (Realist English). Gold is ending the week around $3,988–3,992 per ounce, consolidating after one of the most dramatic half‑years in its history.
In January, the metal hit an all‑time high of $5,598, but by the end of June it had crashed below $4,000, losing more than 26%. The second quarter was gold’s weakest in 12 years (a 14% drop).
At the heart of the drama is the clash between geopolitics and US monetary tightening.
Consolidation After the Plunge
As of July 17, spot gold is trading near $3,988 per ounce, recovering from intra‑day lows seen at the start of the month. Russia’s Central Bank set its official price for July 17 at 10,228.55 rubles/gram.
June was the worst month of the year: the ounce price fell 12% to $4,008, and the second quarter as a whole was the weakest in 12 years. Current levels are roughly 6% below the start of the year.
The market remains under pressure, consolidating near $4,100 — a level the World Gold Council considers “fair value” for the coming months.
Why Gold Fell: Two Main Factors
The drop from record highs is explained by a combination of two key factors.
1. Shift in Fed Rate Expectations
The main reason for the plunge was not geopolitics but Federal Reserve policy. The turning point came in June after the first Fed meeting under new Chair Kevin Warsh. The rate was kept unchanged, but the rhetoric was more hawkish than expected: minutes showed that several committee members had already favoured a hike in June.
According to CME FedWatch, markets are pricing in a 58% probability of a rate hike in September (47.1% for 25 bps, 11.1% for 50 bps). Higher rates weigh on gold, which yields no interest: each rise in rate expectations increases the opportunity cost of holding the metal.
US inflation reached 4.2% in June — a three‑year high. In this environment, markets are no longer expecting rate cuts but are pricing in hikes.
2. Removal of the Geopolitical Premium
In the first half of the year, the geopolitical premium built into the gold price due to the US‑Iran conflict was substantial. The US‑Iran agreement in mid‑June stripped that premium from the price.
Notably, even the new escalation on July 8 (the breakdown of the memorandum, US strikes and Iranian retaliatory attacks, and a nearly 7% spike in oil) did not support gold: at one point, prices dipped towards $4,040.
In the market’s view, escalation through higher oil means higher inflation and a more hawkish Fed — which is negative for gold.
Additional Pressure: ETFs and a Rotation into Equities
Two more factors add to the pressure.
ETF outflows. In May, gold ETFs lost 16 tonnes, and withdrawals continued in June. About 298 tonnes of ETF gold are “under water” by nearly $4,000, which could cap any upside. According to the World Gold Council, rolling 90‑day flows have fallen from a peak of $30 billion in late February to negative territory.
A stronger dollar. The conflict with Iran has strengthened the US dollar, and gold traditionally moves in the opposite direction.
Rotation into tech stocks. Investors are shifting into technology equities, diverting capital away from safe‑haven assets.
Support Factors: Central Banks and Asia
Despite the pressure, the gold market is underpinned by two powerful fundamental pillars.
Central Banks Keep Buying
In the first quarter of 2026, central banks purchased 244 tonnes of gold — above the five‑year average. According to a World Gold Council survey, 89% of central banks expect global gold reserves to rise over the next 12 months, and a record 45% plan to increase their own holdings.
Goldman Sachs confirms that central‑bank buying will continue to grow throughout 2026. As Bernstein notes, reserve diversification into gold remains a “key bullish thesis.”
Asian Demand Is Growing
The first half of 2026 demonstrated the growing influence of Asian markets on gold pricing. Although selling occurred mainly during US trading hours, Asian investors regularly provided strong rebounds.
Chinese gold consumption remains robust: in the first quarter of 2026, non‑monetary imports averaged 123.1 tonnes per month, versus 55.5 tonnes in Q1 2025.
Institutional Forecasts: From Cautious to Bullish
Forecasts from leading financial institutions vary widely — from moderately pessimistic to confidently bullish.
World Gold Council (WGC)
In its semi‑annual review of July 1, the WGC forecasts that, under current conditions, gold will trade in a range of ±5% around $4,100 per ounce** in the second half.
However, if economic or geopolitical conditions worsen, gold could resume its rise above $4,500, and with strong signals it could approach $5,000.
HSBC
The bank lowered its average forecast for 2026 to $4,560 (from $4,864) and expects gold to trade in a wide range of $3,800–$4,700 through year‑end, with a year‑end target of $4,750 and $5,025 by end‑2027.
HSBC notes that the supporting factors for gold — budget deficits, economic uncertainty, and debt burdens — remain in place.
Bernstein
The investment bank set a 2026 price target of $4,533 per ounce, with a second‑half target of $4,375.
Bernstein does not expect an aggressive Fed tightening cycle and believes ETF outflows will be limited.
Goldman Sachs
Goldman Sachs maintains one of the most optimistic forecasts: $5,400 per ounce by end‑2026. However, analysts warn that prices could face short‑term pressure if investors are forced to sell liquid assets under market stress.
Consensus Forecast
Average analyst estimates compiled by VanEck project an annual average gold price of $4,700 in 2026 and 2027, and above $4,000 through 2029.
What Next: Three Scenarios for the Second Half
The World Gold Council outlines three main scenarios:
- Base case (“macro‑consensus”) — moderate growth, high inflation, and limited central‑bank tightening. Gold stays in a ±5% range around $4,100.
- Upside (“uptrend”) — worsening economic or geopolitical conditions, a reversal in rate expectations, or a wave of dip‑buying. Gold returns to $4,500–$5,000.
- Downside (“price consolidation”) — sustained growth, rising yields, and calm markets. A drop of 5–15%, but a fall of more than 10% could be limited by dip‑buying.
As the WGC notes, gold remains sensitive to geopolitical risks and sudden shifts in investor sentiment. However, experts emphasise that even in a bearish scenario, physical demand from central banks and Asian buyers provides a structural floor, and a sustained break below $4,000 would require a truly deflationary shock.